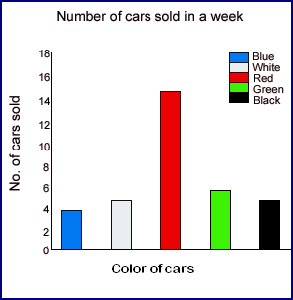
Use the chart to answer the questions.
|
|
| 2. The horizontal axis shows: |
| 3. The vertical axis shows: |
| 4. Which color of car sold the most? |
| 5. How many blue cars were sold? |
| 6. Which two colors of cars sold the same amount? |
| 7. There were six cars of this color sold. |
| 8. How many red cars were sold? |
| 9. What is the total number of black and white cars sold? |
| 10. How many total cars (all colors) were sold in this week? |
